
Currency Pairs: Any
Timeframes: Any
Minimum Deposit: Any
Recommended Account Type: ECN or Raw Spread
Leverage: From 1:30 to 1:1000
Recommend broker: Roboforex
Recommend Vps: GoVPSFX
Do you want to earn automatically and stably 5-10%/month with safe DD? Look here
The Kernel Support and Resistance indicator for TradingView is a sophisticated tool designed to help traders identify dynamic support and resistance levels using kernel regression techniques.
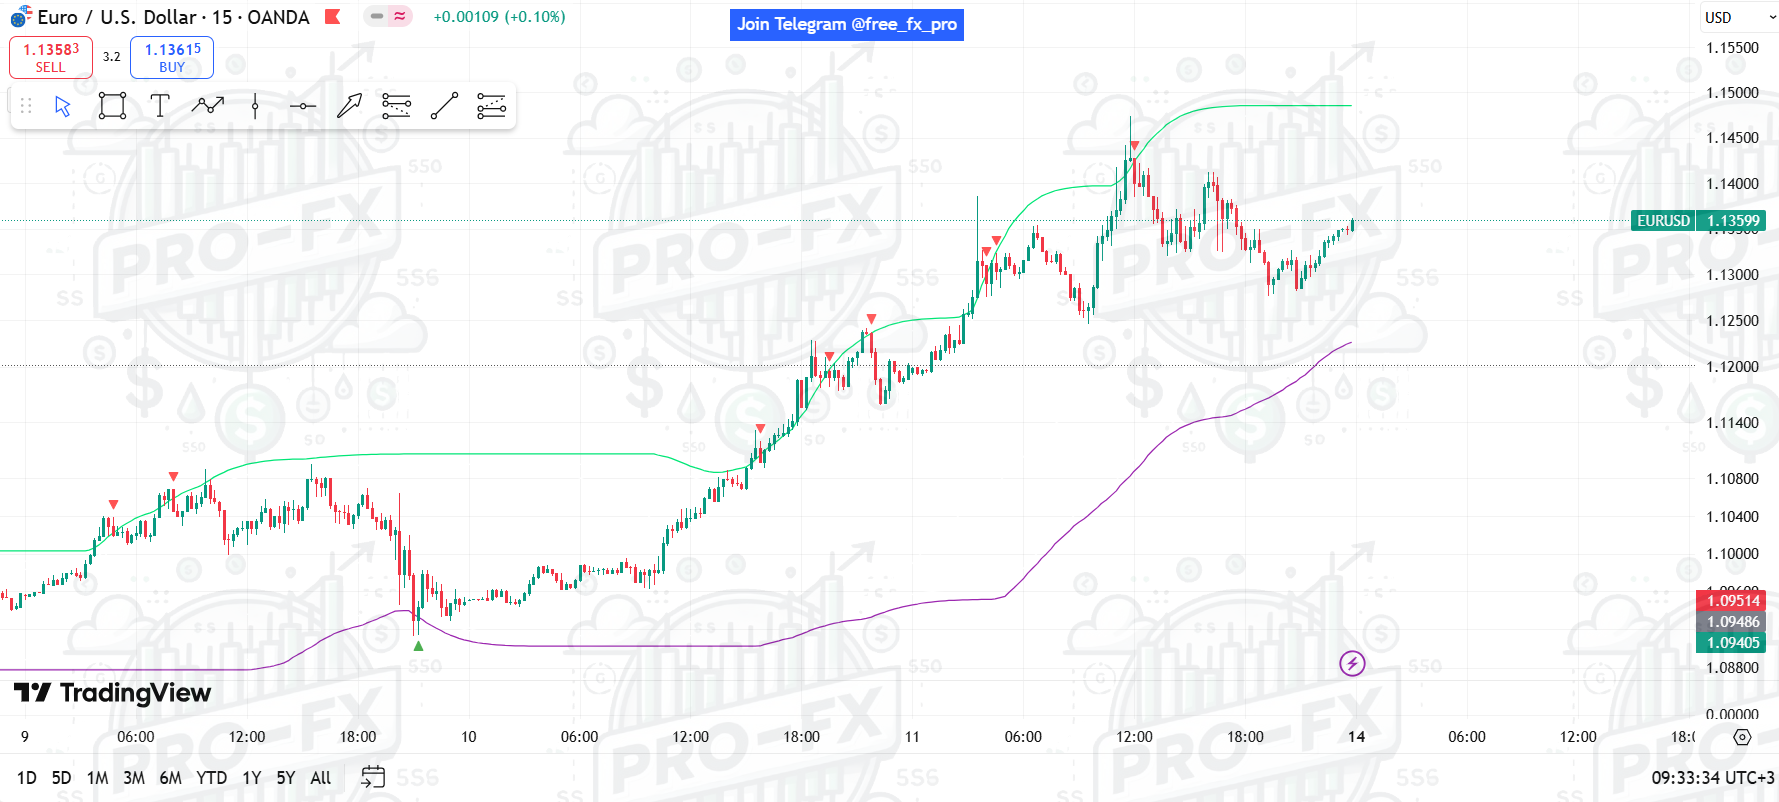
Unlike traditional methods that rely on pivot points or historical highs and lows, this indicator applies kernel regression—a statistical method that estimates the best-fitting curve for price data—to smooth out market noise and highlight key price zones where the market is likely to react.
How It Works:
The indicator plots multiple kernel regression lines (default is 8) with different types and parameters, creating a “ribbon” effect. These lines highlight areas where price tends to find support (demand exceeds supply) or resistance (supply exceeds demand). Traders can use these zones to identify potential entry/exit points, set stop-loss levels, or anticipate breakouts when price breaches a strong level.


Reviews
There are no reviews yet.